hiperf
hiperf is a command-line tool provided to capture performance data of a specific program or the entire system, like the kernel's perf tool. It can run on Windows, Linux, and macOS.
Environment Setup
-
The environment for OpenHarmony Device Connector (hdc) has been set up. For details, see Environment Setup.
-
The devices are properly connected and hdc shell is executed.
hiperf
| Parameter | Description |
|---|---|
| -h/--help | Displays the help information. |
| --debug | Outputs debug logs. |
| --hilog | Writes logs to the hilog. |
| --logpath | Specifies the log path. |
| --logtag | Specifies the log level. |
| --mixlog | Outputs mixed logs. |
| --much | Output as many logs as possible. |
| --nodebug | Outputs no log. |
| --verbose | Outputs verbose logs. |
help
Run the --help command to view help information.
hiperf --help
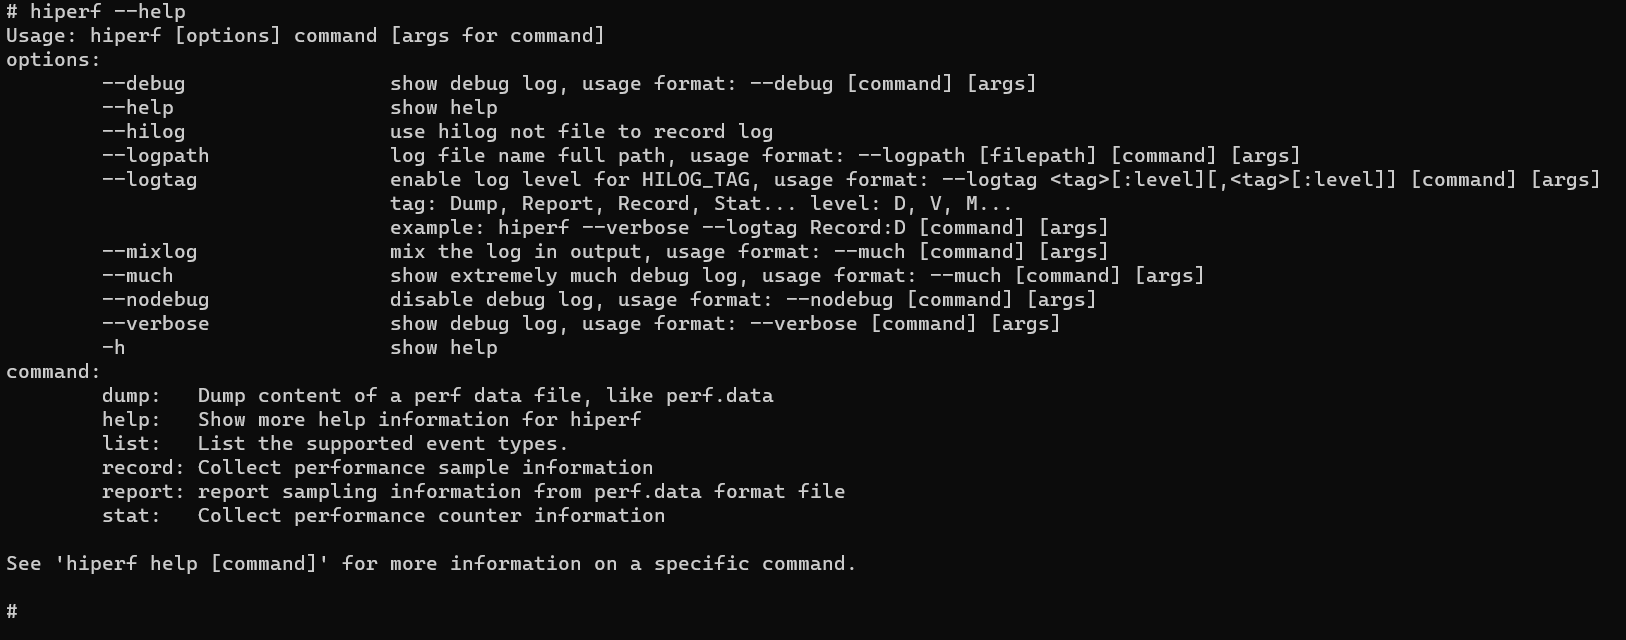
Run the following command to view the help information about a command:
hiperf [command] --help
list
Lists all the supported events on the device. The event names are used for the -e and -g parameters of the stat and record commands.
Parameters of the list command
| Parameter | Description |
|---|---|
| -h/--help | Displays the help information. |
| hw | Lists the hardware events. |
| sw | Lists the software events. |
| tp | Tracepoint event. |
| cache | Lists the hardware cache events. |
| raw | Lists the original PMU events. |
Usage: hiperf list [event type name]
Run the help command to query the supported event types.
hiperf list --help
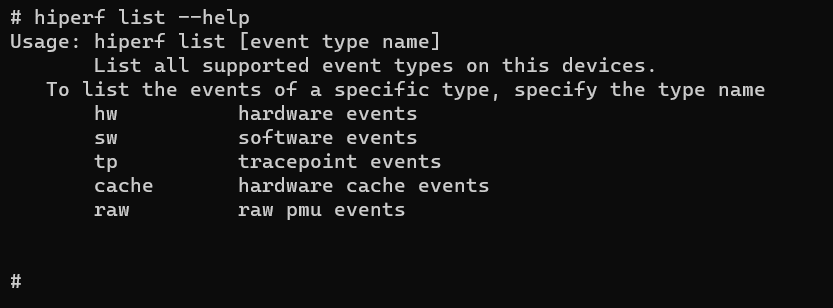
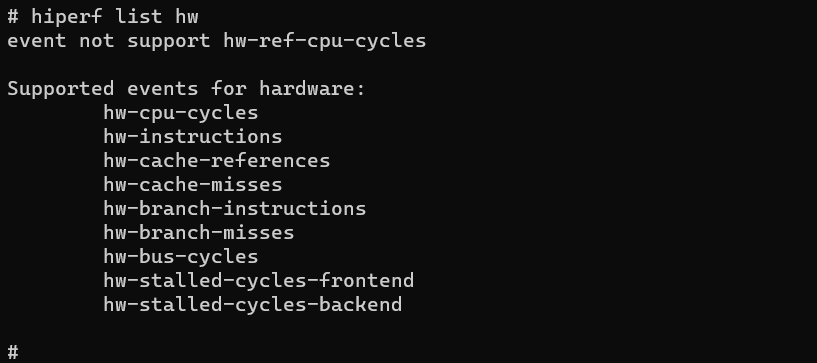
Run the following command to list the hardware events supported and not supported by the device.
hiperf list hw
record
Specifies the target program for sampling and saves the sampled data to a file (/data/local/tmp/perf.data by default).
Parameters of the record command
| Parameter | Description |
|---|---|
| -h/--help | Displays the help information. |
| -a | Collects the full information of the system for evaluating all processes and threads. |
| --exclude-hiperf | Collects no hiperf data. |
| -c | Specifies the ID of the CPU to collect its data. |
| --cpu-limit | Sets the maximum CPU usage during collection. Value range: 1 to 100. The default value is 25. |
| -d | Sets the collection duration. |
| -f | Sets the collection frequency. The default value is 4000 times per second. This parameter cannot be used together with --period. |
| --period | Sets the event collection period, that is, the number of events to be collected each time. This parameter cannot be used together with -f. |
| -e | Specifies the events to collect, which are separated by commas (,). |
| -g | Specifies the event groups to collect, which are separated by commas (,). |
| --no-inherit | Collects no subprocess data. |
| -p | Specifies the IDs of the processes to collect, which are separated by commas (,). This parameter cannot be used together with -a. |
| -t | Specifies the IDs of the threads to collect, which are separated by commas (,). This parameter cannot be used together with -a. |
| --exclude-tid | Specifies the IDs of the threads not to collect, which are separated by commas (,). This parameter cannot be used together with -a. |
| --exclude-thread | Specifies the names of the threads not to collect, which are separated by commas (,). This parameter cannot be used together with -a. |
| --exclude-process | Specifies the names of the processes not to collect, which are separated by commas (,). This parameter must be used together with -a. |
| --offcpu | Traces the time when a thread is out of CPU scheduling. |
| -j | Samples branch stacks. The following filters are supported: any, any_call, any_ret, ind_call, ind_jmp, cond and call. |
| -s/--callstack | Sets the stack mode. |
| --kernel-callchain | Collects kernel stack information. This parameter must be used together with -s fp/dwarf. |
| --callchain-useronly | Collects only user stacks. |
| --delay-unwind | Unwinds the stack after recording. If -s dwarf is set, the stack is unwound during recording. |
| --disable-unwind | Disables the unwinding of the stack during recording by default when -s dwarf is set. |
| --disable-callstack-expand | Disables the 64 KB stack limit when -s dwarf is set. By default, call stacks are combined to a more complete call stack, which may be inaccurate. |
| --enable-debuginfo-symbolic | Parses the symbols in the .gnu_debugdata section of elf when -s fp/dwarf is set. By default, the symbols are not parsed. |
| --clockid | Sets the type of the clock to collect, which can be monotonic or monotonic_raw. |
| --symbol-dir | Specifies the directory of the online symbol table file. |
| -m | Sets the number of mmap pages. Value range: 2 to 1024. The default value is 1024. |
| --app | Specifies the names of the applications to collect, which are separated by commas (,). The applications must be in debuggable mode. If an application is not started, the system waits for 20s. |
| --chkms | Sets the check interval. Value range: 1 to 200. The default value is 10. |
| --data-limit | Sets the limit of the output data size. When this limit is reached, the collection stops. By default, there is no limit. |
| -o | Specifies the output file path. |
| -z | Outputs the data in a compressed file. |
| --restart | Collects performance indicator information about application startup. If a process is not started within 30 seconds, the record exits. |
| --verbose | Outputs a more detailed report. |
| --control [command] | Controls the collection command. The following commands are supported: prepare/start/pause/resume/output/stop. |
| --dedup_stack | Deletes duplicate stacks from a record. This parameter cannot be used together with -a. |
| --cmdline-size | Sets the value of the /sys/kernel/tracing/saved_cmdlines_size node. Value range: 512 to 4096. |
| --report | Obtains the stack report after collection. This parameter cannot be used together with -a. |
| --backtrack | Collects data in a previous period. This parameter must be used together with --control prepare. |
| --backtrack-sec | Collects the duration of previous data. The value ranges from 5 to 30. The default value is 10s. This parameter must be used together with --backtrack. |
| --dumpoptions | Dumps the command options. |
Usage: hiperf record [options] [command [command-args]]
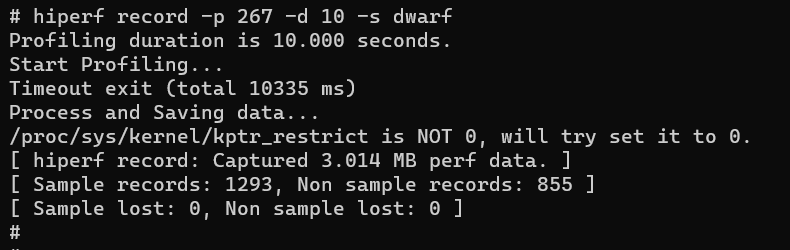
Sample the process 267 for 10 seconds and use dwarf to collect and unwind stack memory of the process.
hiperf record -p 267 -d 10 -s dwarf
stat
Monitors the specified application and periodically prints the values of performance counters.
Parameters of the stat command
| Parameter | Description |
|---|---|
| -h/--help | Displays the help information. |
| -a | Collects the full information of the system for evaluating all processes and threads. |
| -c | Specifies the ID of the CPU to collect its data. |
| -d | Sets the collection duration. |
| -i | Sets the interval for printing stat information. Unit: ms. |
| -e | Specifies the events to collect, which are separated by commas (,). |
| -g | Specifies the event groups to collect, which are separated by commas (,). |
| --no-inherit | Collects no subprocess data. |
| -p | Specifies the IDs of the processes to collect, which are separated by commas (,). This parameter cannot be used together with -a. |
| -t | Specifies the IDs of the threads to collect, which are separated by commas (,). This parameter cannot be used together with -a. |
| --app | Specifies the names of the applications to collect, which are separated by commas (,). The applications must be in debuggable mode. If an application is not started, the system waits for 10s. |
| --chkms | Sets the check interval. Value range: 1 to 200. The default value is 10. |
| --per-core | Obtains the print count of each CPU core. |
| --pre-thread | Obtains the print count of each thread. |
| --restart | Collects performance indicator information about application startup. If a process is not started within 30 seconds, the record exits. |
| --verbose | Outputs a more detailed report. |
| --dumpoptions | Dumps the command options. |
| --control [command] | Controls the collection command. The commands include prepare, start, and stop. NOTE: This parameter is supported since API version 20. |
| -o | Sets a path to output a file. This parameter must be used together with --control prepare. NOTE: This parameter is supported since API version 20. |
Usage: hiperf stat [options] [command [command-args]]
Monitor the performance counter of process 2349 on CPU0 for 3 seconds.
hiperf stat -p 2349 -d 3 -c 0
dump
Reads the data in perf.data without processing the file. You can check whether the original sampling data is correct.
Parameters of the dump command
| Parameter | Description |
|---|---|
| -h/--help | Displays the help information. |
| --head | Outputs only the data header and attributes. |
| -d | Outputs only data segments. |
| -f | Outputs only additional functions. |
| --syspath | Specifies the path of the symbol table file. |
| -i | Specifies the resource file path. |
| -o | Specifies the output file path. If this parameter is not set, the file is displayed on the screen. |
| --elf | Outputs the ELF file. |
| --proto | Outputs data in ProtoBuf format. |
| --export | Exports user stack data to a split file and generates ut data. |
Usage: hiperf dump [option] \<filename\>
Run the dump command to read the /data/local/tmp/perf.data file and export it to the /data/local/tmp/perf.dump file.
hiperf dump -i /data/local/tmp/perf.data -o /data/local/tmp/perf.dump

report
Displays the sampled data (read from perf.data) in required format (such as JSON or ProtoBuf).
Parameters of the report command
| Parameter | Description |
|---|---|
| -h/--help | Displays the help information. |
| --symbol-dir | Specifies the path of the symbol table file. |
| --limit-percent | Sets the percentage of the content to display. |
| -s | Displays the stack mode. |
| --call-stack-limit-percent | Sets the percentage of the stack to display. |
| -i | Specifies the resource file path. The default value is perf.data. |
| -o | Specifies the output file path. If this parameter is not set, the file is displayed on the screen. |
| --proto | Outputs data in ProtoBuf format. |
| --json | Outputs data in JSON format. |
| --diff | Displays the differences between the -i and **--diff **files. |
| --branch | Displays the branch in the address instead of the IP address. |
| --<keys> <keyname1>[,keyname2][,...] | Specifies the keywords, which can be comms, pids, tids, dsos, funcs, from_dsos or from_funcs, for example, --comms hiperf. |
| --sort [key1],[key2],[...] | Sorts the data by keyword. |
| --hide_count | Hides values in the report. |
| --dumpoptions | Dumps the command options. |
Usage: hiperf report [option] \<filename\>
Display a common report, with the sampling limit of 1%.
hiperf report --limit-percent 1
script
You can use a script to sample data and generate flame graphs. You can obtain the script from developtools_hiperf.
-
Sample data.
Run command_script.py to sample data. This script packages the report command.
usage: command_script.py [-h]
                         (-app PACKAGE_NAME|-lp LOCAL_PROGRAM|-cmd CMD|-p [PID [PID ...]]|-t [TID [TID ...]]|-sw)
                         [-a ABILITY] [-r RECORD_OPTIONS] [-lib LOCAL_LIB_DIR]
                         [-o OUTPUT_PERF_DATA] [--not_hdc_root]
Sample the com.ohos.launch package.
python command_script.py -app com.ohos.launchSample the hdcd process.
python command_script.py -lp hdcd -
Collect symbol tables.
Run recv_binary_cache.py to collect symbol tables. This script searches for the ELF in the specified paths based on the files and libraries recorded in perf.data and their buildids.
usage: recv_binary_cache.py [-h] [-i PERF_DATA] [-l LOCAL_LIB_DIR [LOCAL_LIB_DIR ...]]The following example specifies two symbol table paths.
python recv_binary_cache.py -l Z:\OHOS_MASTER\out\ohos-arm-release\lib.unstripped Z:\OHOS_MASTER\out\ohos-arm-release\exe.unstrippedThe ELF files of the specified symbol table paths are copied to the binary_cache folder. If the paths do not exist, the file in the device will be copied.
-
Generate a flame graph.
Run make_report.py to display the sampled data in an HTML page.
usage: make_report.py [-h] [-i PERF_DATA] [-r REPORT_HTML]Generate an HTML file. The default file name is hiperf_report.html.
python make_report.py -i perf.data
你可能感兴趣的鸿蒙文章
harmony 鸿蒙Performance Analysis Kit
harmony 鸿蒙Analyzing Application Freeze
harmony 鸿蒙Development of Application Recovery
harmony 鸿蒙Development of Error Manager
harmony 鸿蒙Introduction to HiAppEvent