harmony 鸿蒙Debugging in DevEco Studio
Debugging in DevEco Studio
DevEco Studio provides a wide range of debugging features, which can be used to detect and rectify program errors during NDK development. These debugging features include:
Debugging using a real device: Run your application or atomic service on a real device to see how it behaves on the device. For details, see Debugging Overview. During debugging, if the source code path of the .so file of the local compilation device is different from the configured C++ source code path, fix the issue using either of the following methods:
- Create the mapping between files.
After you debug code with the Step Into feature, you will be prompted to associate the source code. Click Select file and select the local C++ source code for association. For details, see Third-Party Code Debugging.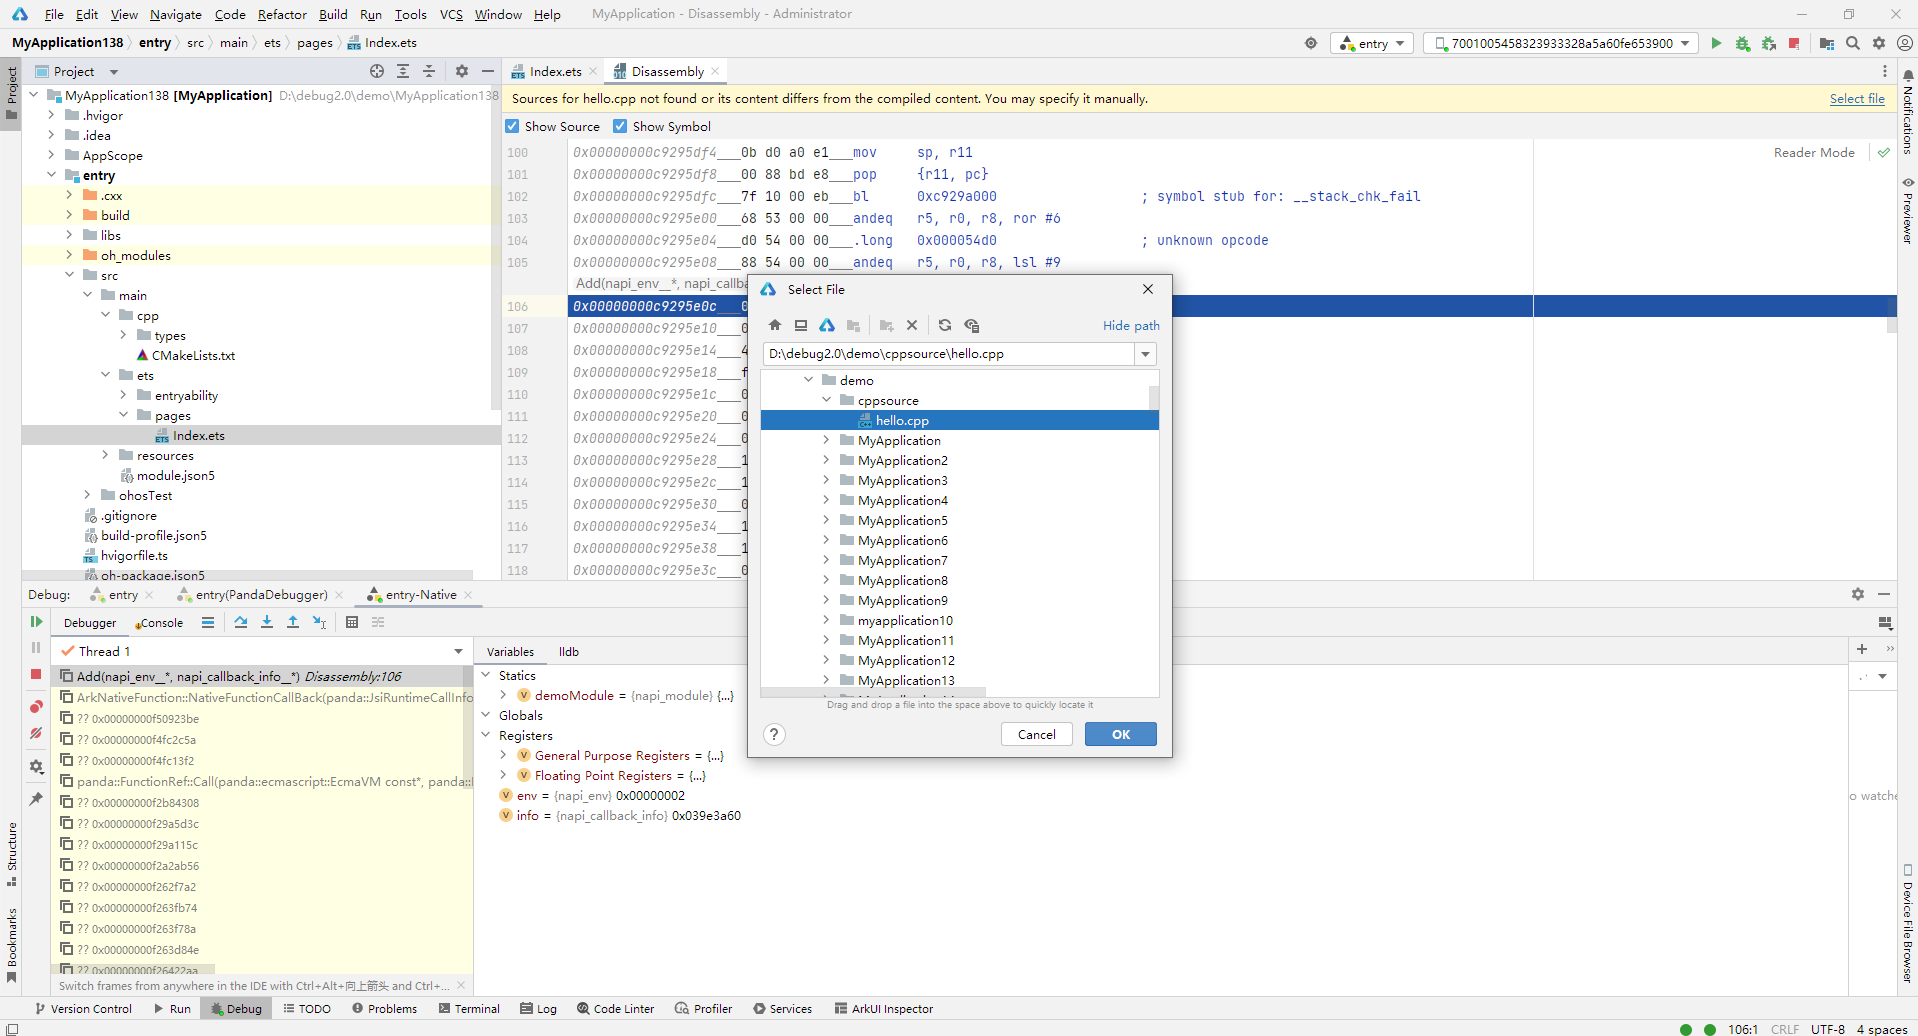
- Create the mapping between paths.
Choose Run > Edit Configurations, select a module, switch to the Debugger tab, select Native, and add the settings set target.source-map “/buildbot/path” “/my/path” command on the LLDB Startup Commands tab page to establish the mapping. Parameter 1 indicates the source code path in the compilation environment, and parameter 2 indicates the local source code path.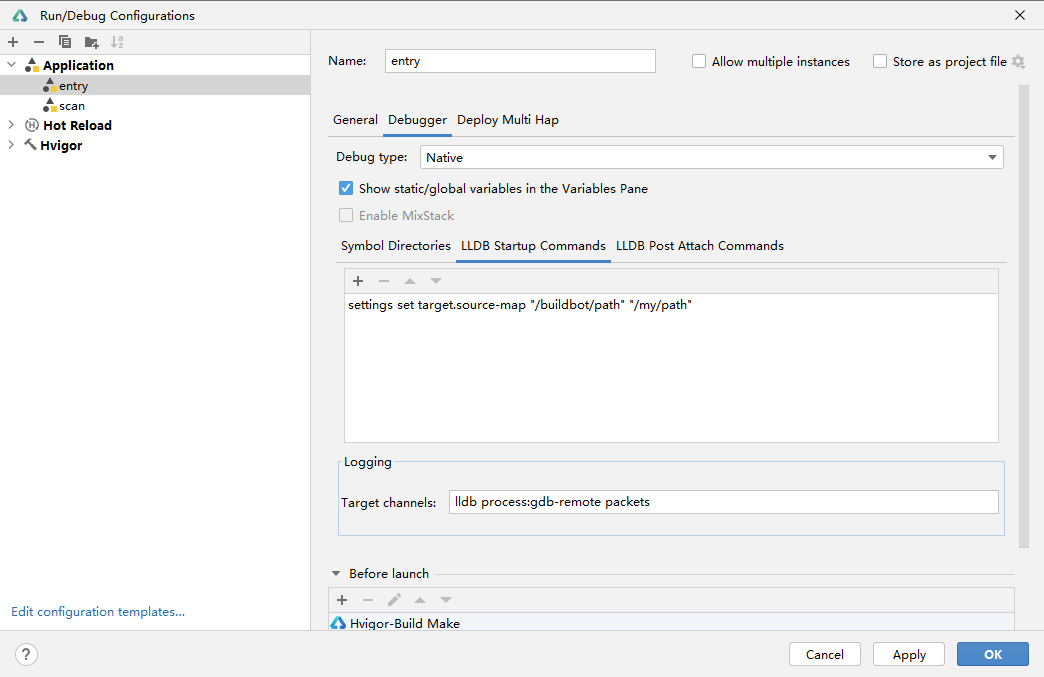
- Create the mapping between files.
C/C++ reverse debugging: During debugging, you can roll back to historical lines and breakpoints to view related variable information. For details, see Reverse Debugging.
你可能感兴趣的鸿蒙文章
harmony 鸿蒙Building an NDK Project with CMake
harmony 鸿蒙Building an NDK Project with the DevEco Studio Template
harmony 鸿蒙NDK Project Building Overview
harmony 鸿蒙Building an NDK Project with Prebuilt Libraries
harmony 鸿蒙C/C++ Library Mechanisms
harmony 鸿蒙Creating an NDK Project
- 所属分类: 后端技术
- 本文标签:
热门推荐
-
2、 - 优质文章
-
3、 gate.io
-
8、 golang
-
9、 openharmony